Genomic evidence reveals three W-autosome fusions in Heliconius butterflies
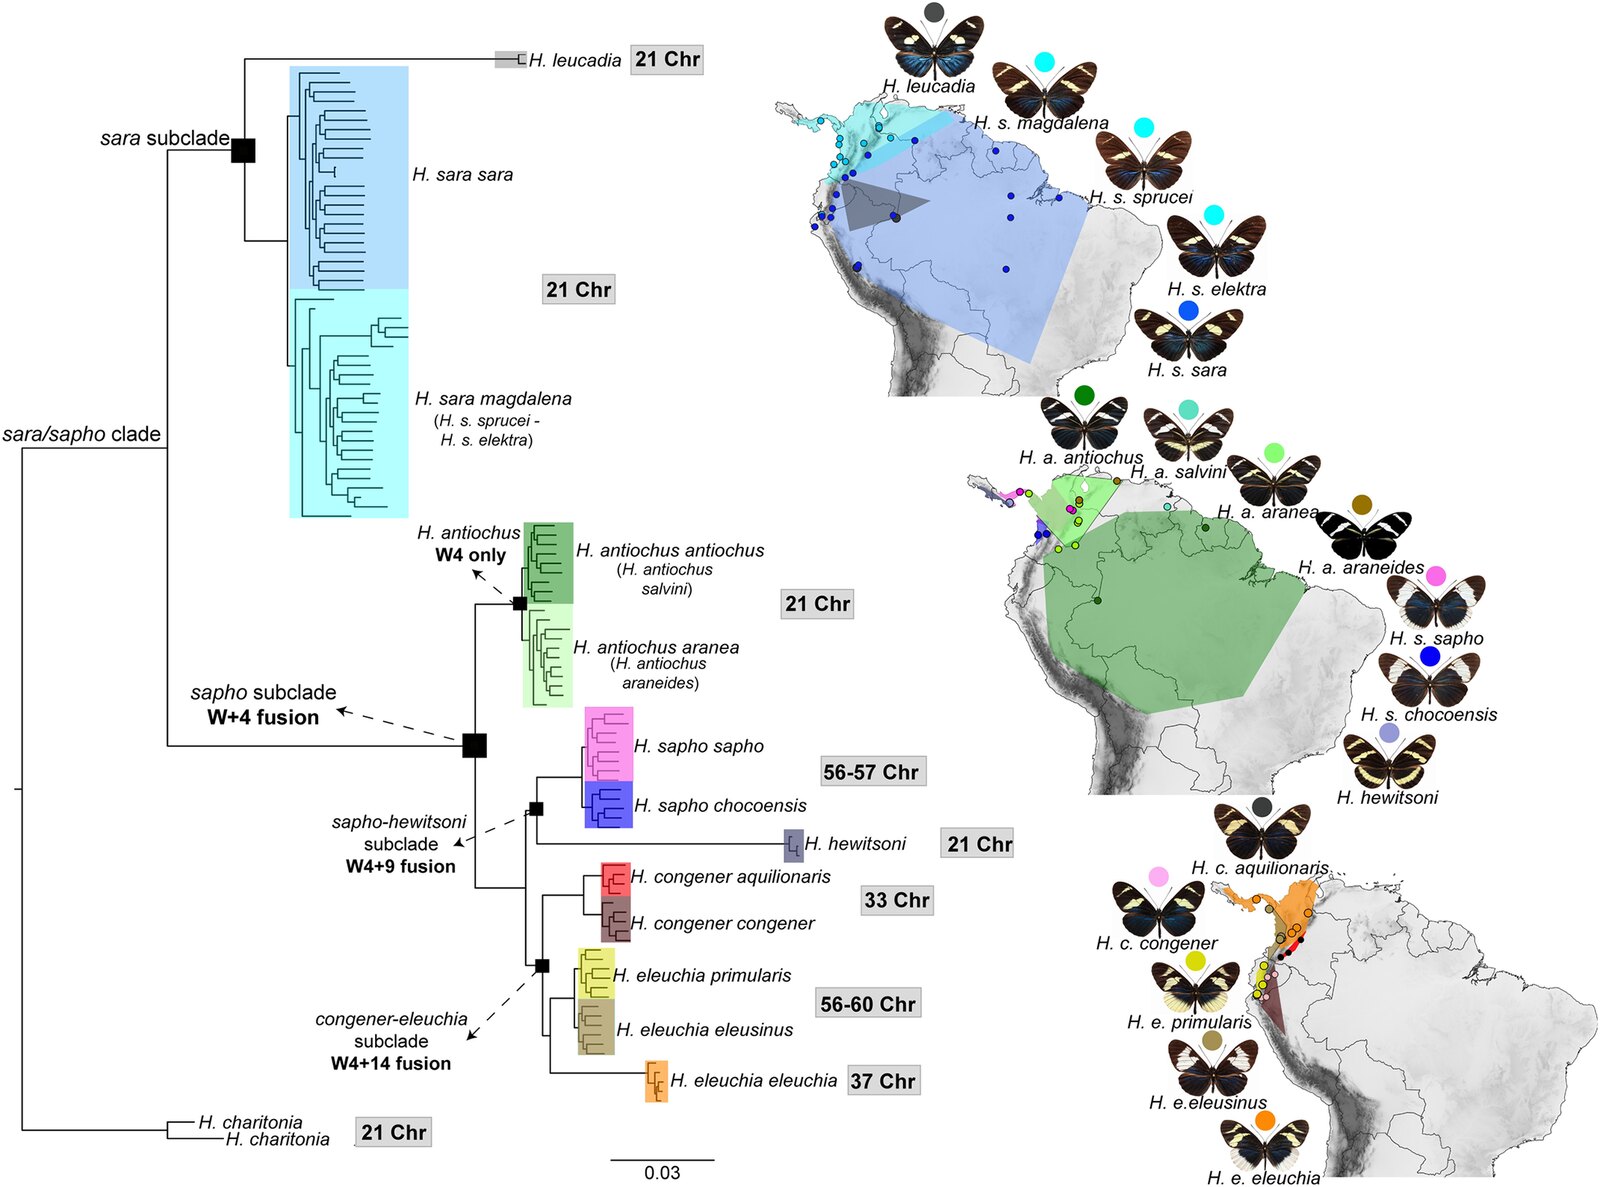
Chromosome counts and three inferred fusions between the female-specific W chromosome and autosomes.
A shared scientific resource for understanding and conserving Neotropical butterflies and moths.
A reference genome is the assembled DNA sequence of one individual, used as the standard for its species. It supports research in conservation, ecology, evolution, taxonomy, behaviour, agriculture and forestry.
Researchers can compare it with other species to see how genes and chromosomes have changed. They can also align lower-cost short-read data from many individuals to the reference, then study relationships, population size and connectivity, natural selection and gene exchange.
Each tier answers different questions, at a different cost.
Which species is this butterfly?
All 16 bases match H. cydno. A cross marks each base where another species differs.
Tier 1
A short, standard stretch of DNA, matched against a reference library, identifies the species. It is the cheapest of the three tiers.
Where do the two populations differ?
1 of 5 sites tells the populations apart: T above, C below. The others are shared or mixed.
Tier 2
Short reads from many individuals, aligned to a reference genome, show where populations differ and help tell species apart.
How do reads become chromosomes?
Tier 3
Chromosome-scale assemblies: one continuous sequence per chromosome instead of many fragments. Resequenced reads are aligned to them.
Caligo will analyse these genomes together, so each dataset is also a chance to train. Courses and learning materials come with hands-on work that pairs experienced genomicists with researchers learning new skills.
This starts with the first pilot projects. To take part, contact the project leads.
Explore the proposed pilot projectsBogotá, Colombia
The network’s first activity in Latin America, with the Red Colombiana de Genómica. Eight Heliconius species were sequenced during the workshop.
The Heliconius pilot projectCampinas, Brazil
Hackathon at the Biology of Butterflies and ELEN (Neotropical Lepidoptera meeting) congress: participants assemble reference genomes and analyse the data together.
Congress websiteThese studies show how reference genomes and population data can uncover chromosome change, rapid radiations and hybrid origins.
Chromosome counts and three inferred fusions between the female-specific W chromosome and autosomes.
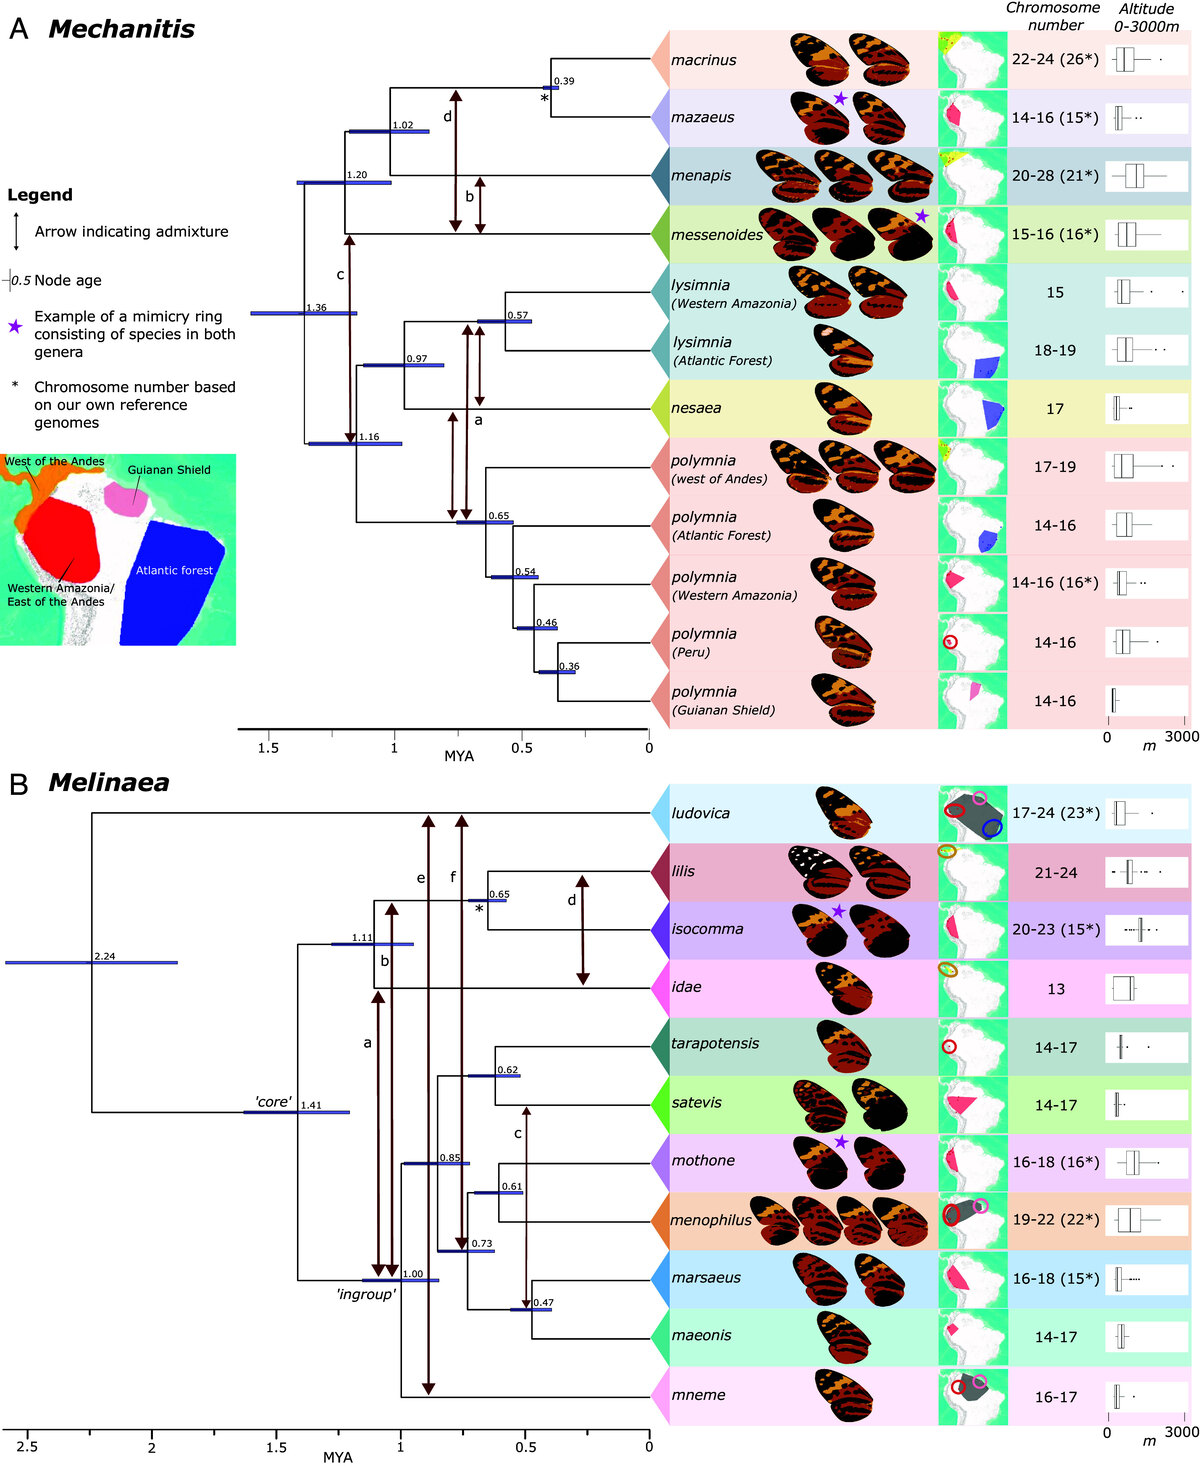
Two rapid radiations viewed through evolutionary relationships, geography, chromosome number and evidence of hybridisation.
van der Heijden et al. 2025 · PNAS · Fig. 2 · CC BY 4.0 · Resized and re-encoded from the PMC-hosted figure.
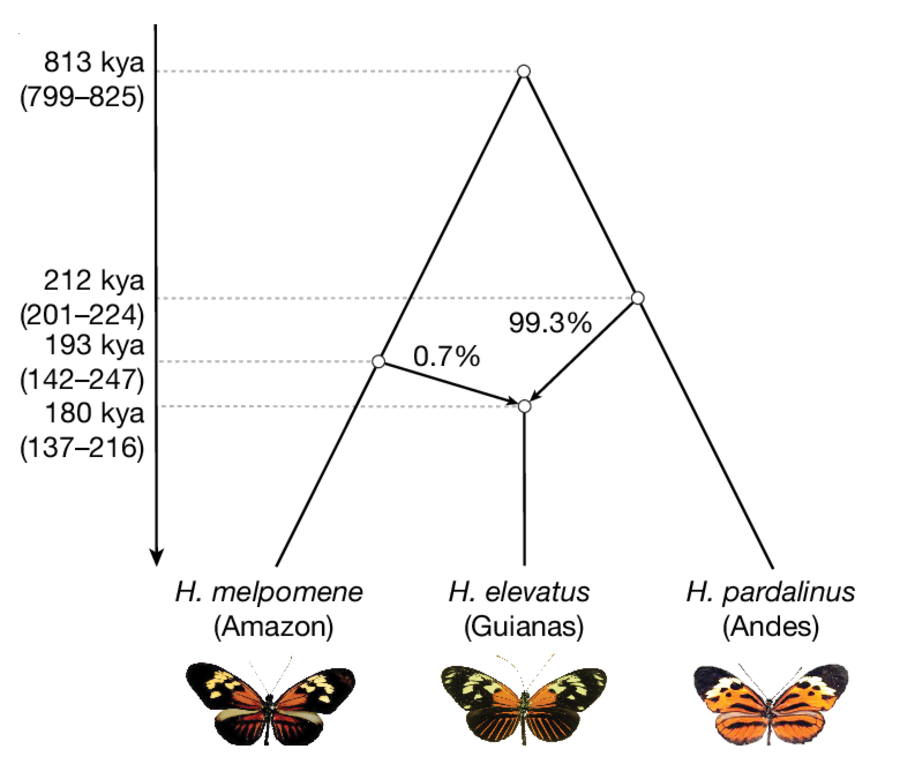
A cropped panel showing the inferred hybrid origin of Heliconius elevatus and the genomic contribution from each parental lineage.
Rosser et al. 2024 · Nature · Fig. 1e · CC BY 4.0 · Cropped to panel e, with the panel letter removed and a white margin added.
Four published findings lead into Caligo’s proposed pilot projects and show what new samples or genomic data could reveal next.
 1 · Chromosome evolution
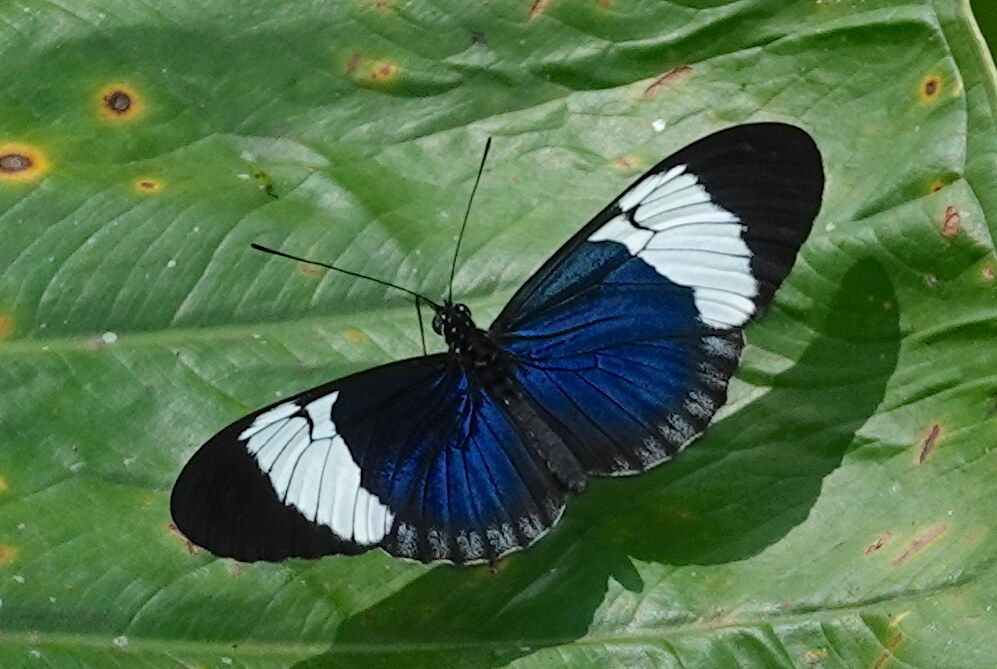
Chromosome number remains stable for millions of years in many animal lineages. Some butterflies and moths are different. Most Heliconius species carry 21 chromosomes in the haploid set, but five species in the sapho group have up to 60 after repeated fissions.
Lepidopteran chromosomes are holocentric. During cell division, the machinery that moves them can attach along the whole chromosome instead of at one centromere. A broken fragment can therefore retain the machinery needed to move into a daughter cell. This may help chromosome fissions persist, but it does not explain why they spread through a population.
In the Heliconius sapho group, genomic studies identified three W-autosome fusion events. The W fused with chromosome 4 in their common ancestor, followed by separate fusions with chromosomes 9 and 14 in two descendant lineages.
What Caligo proposes nextSee the proposed Heliconius study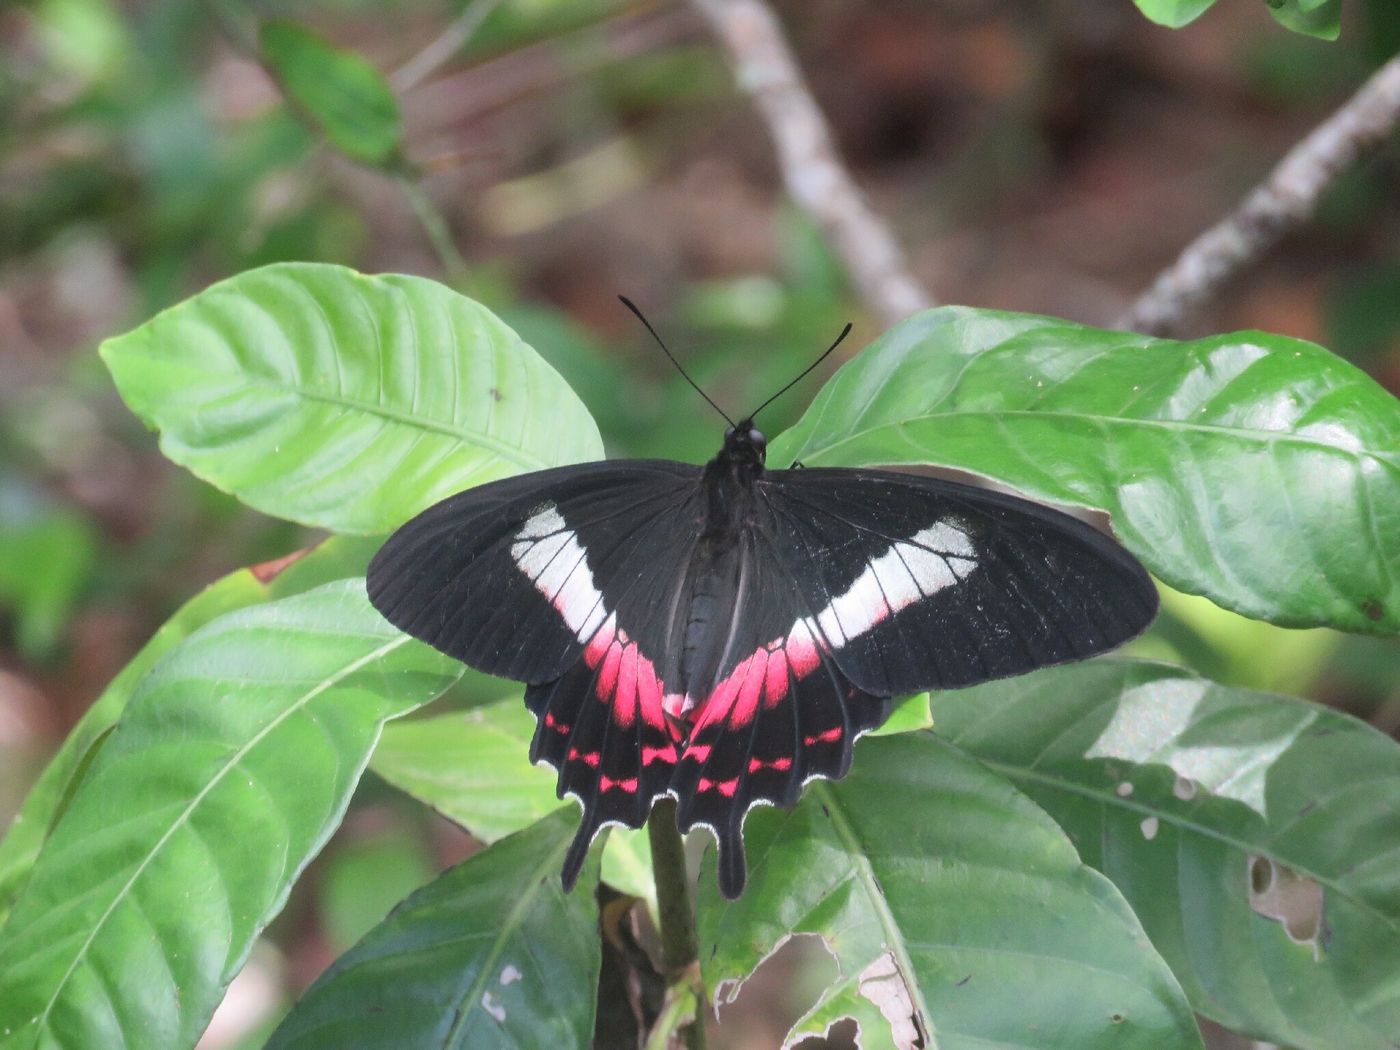 2 · Population connectivity
Parides ascanius is restricted to coastal restinga and wetlands in south-eastern Brazil. The IUCN assessed it as Vulnerable globally in 2018. Brazil’s national assessment listed it as Endangered in 2021.
Seraphim and colleagues used mitochondrial COI sequences and eight microsatellite markers to compare the surviving populations. Their 2016 study found little genetic structure, no evidence of inbreeding and high migration among most sampled sites, although one population was more isolated by the metropolitan landscape.
The 2016 result provides a baseline but does not show whether the populations remain connected today. A chromosome-scale reference and new population sampling could measure how much diversity remains and whether habitat loss, drainage or fragmentation has interrupted gene flow.
What Caligo proposes nextSee how Caligo would revisit connectivity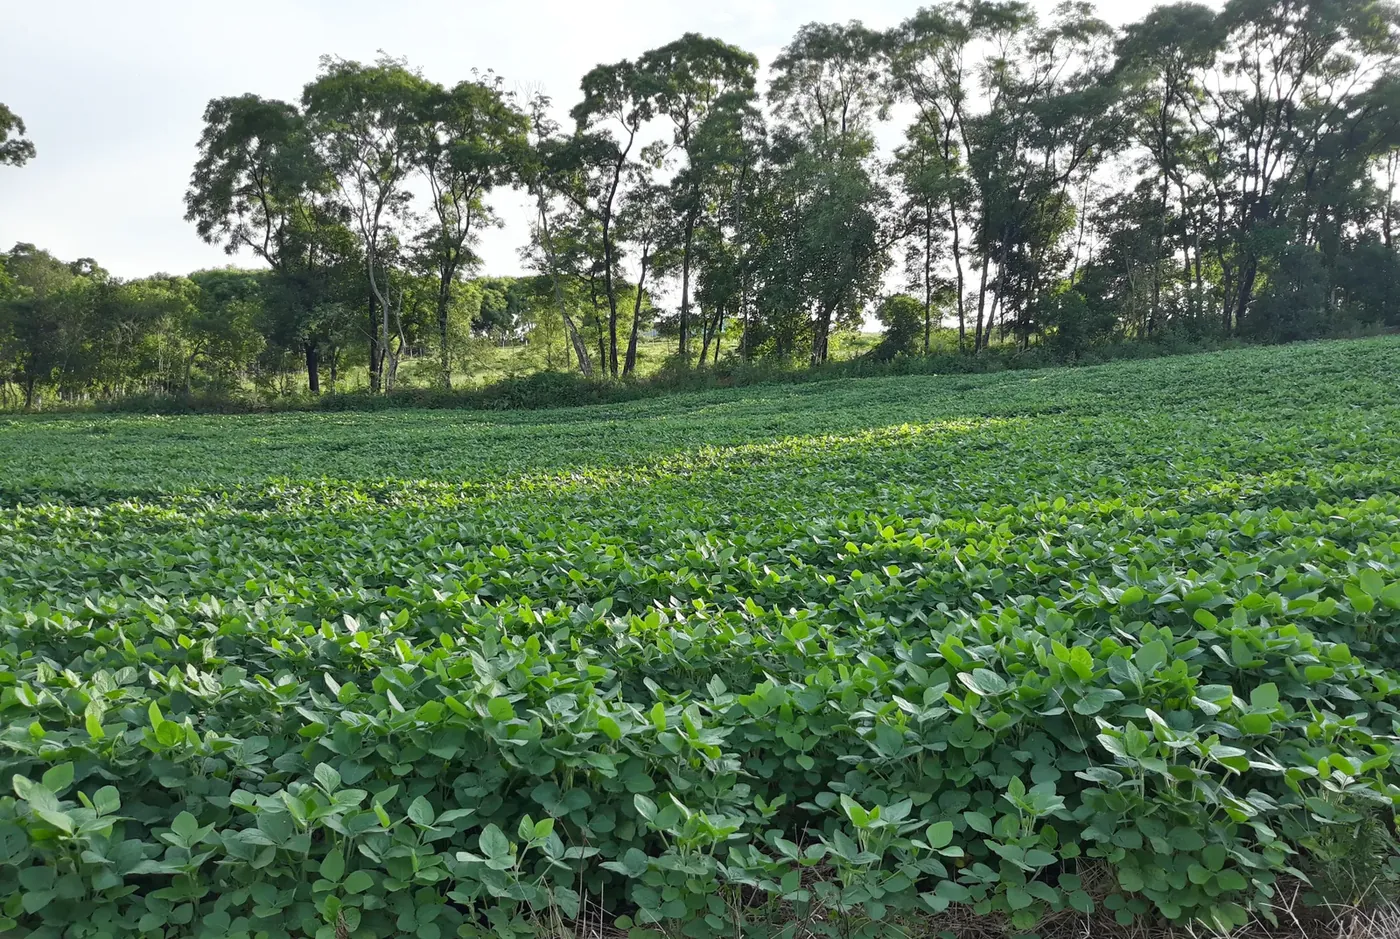 3 · Movement and resistance
Several closely related moth species occur in Brazilian soybean fields and can be difficult to distinguish during monitoring. Reliable identification matters because movement and resistance can differ among species.
Brazilian studies have found that susceptibility to insecticidal proteins is changing, so each species needs repeated testing. Genomic data can distinguish the species, compare movement among populations and identify variants associated with resistance.
Genomes do not measure crop damage or prove that a variant causes resistance by themselves. Field trials, bioassays, agronomy and growers’ observations are still needed to choose a management response.
What Caligo proposes nextSee the proposed soybean landscape studySoybean field in Novo Barreiro, Rio Grande do Sul, Brazil.
Photo: Lucas Friederich / Wikimedia Commons. · Source · CC BY-SA 4.0
 4 · Seasonal migration
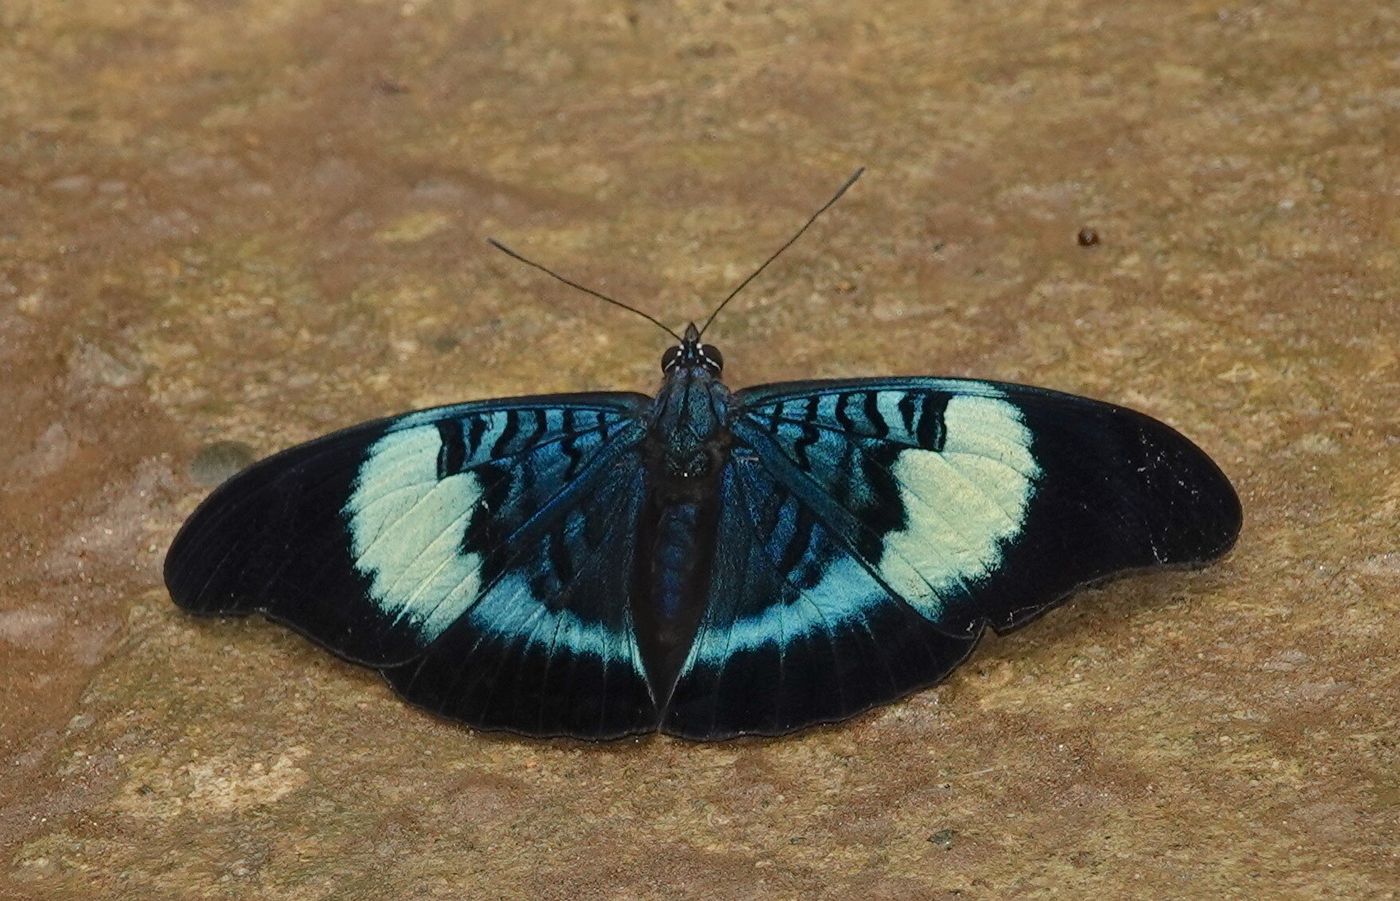
In 2020, Gallice and colleagues recorded 2,509 Panacea prola in 50 one-hour observations in south-eastern Peru. Only 19 flew in another direction. They presented the observation as the first evidence of an Amazonian insect migration.
The closest available genomic reference is from another member of the same subfamily, Batesia hypochlora. It cannot reveal where these butterflies came from, whether they belonged to one population or several, or whether the movement repeats each year.
Comparing samples from different places, seasons and years could estimate ancestry and connectivity. Genomes would still need to be combined with field observations, environmental data or other movement evidence.
What Caligo proposes nextSee how Caligo would trace the migration waveSampling plans need permits, specimen records, agreements on how research results, training and other benefits will be shared, and a plan for managing data.
Requirements differ among countries, and sequencing or exporting samples may require additional permits. Sampling on Indigenous Peoples’ lands requires their consent. Caligo will only support sampling with strong involvement from local researchers.